Program Breakdown
This website presents an example site-level HTML progress report for illustrative purposes only. All provider names, place names, and data shown here are fictional.
This page presents cumulative data with line graphs illustrating monthly trends over time, broken down by program type (ACEs and Substance Use Prevention). Using the toggle below, you can switch between the two program views.
Community Engagement & Staff Training
This section presents monthly data, by provider, on community events, street outreach events, and staff trained.
TipAlignment with Evaluation Plan
Objective 1: Scope and Reach of Programs
- What types of program activities are being implemented, and how often?
101
Total Community Events
across all ACEs providers
July to December 2025
64
Total Street Events
across all ACEs providers
July to December 2025
60
Total Staff Trained
across all ACEs providers
July to December 2025
Community Events
Comunidad Adelante does not collect data on community events because it is not a part of their program model.
Street Events
Client Services & Baseline Data
This section presents monthly data, by provider, on total new clients, average monthly clients, and the overall percentage of new clients with Baseline Data.
TipAlignment with Evaluation Plan
Objective 1: Scope and Reach of Programs
- How many people does each provider serve? What are the target populations?
463
Total New Clients
across all ACEs providers
July to December 2025
406
Total New Primary Clients
across all ACEs providers
July to December 2025
New Clients
This includes primary and secondary new clients, where applicable.
Average Monthly Clients
This includes all primary and secondary clients, both new and continuing.
Centro Familiar
14
average monthly clients
Comunidad Adelante
33
average monthly clients
Family Hope Services
148
average monthly clients
Youth Forward Initiative
44
average monthly clients
Overall Percentage of New Clients with Baseline Data
Please note, all providers have a target of 100% new clients with Baseline Data.
Centro Familiar
69%
of new clients have Baseline Data.
Below target
Comunidad Adelante
100%
of new clients have Baseline Data.
Meeting target
Family Hope Services
97%
of new clients have Baseline Data.
Meeting target
Youth Forward Initiative
51%
of new clients have Baseline Data.
Below target
Discharges
This section presents the overall percentage of positive outcome discharges, by provider.
TipAlignment with Evaluation Plan
Objective 2: Program Strengths and Challenges
- What are the barriers to program implementation and participant success, and how are these being addressed?
- How do participant behaviors and outcomes change over time?
327
Total Discharges
across all ACEs providers
July to December 2025
261
Total Positive Outcome Discharges
across all ACEs providers
July to December 2025
Overall Percentage of Positive Outcome Discharges
Centro Familiar
98%
of discharges are positive outcome discharges.
Surpassing their target of 85% positive outcome discharges
Comunidad Adelante
100%
of discharges are positive outcome discharges.
Surpassing their target of 80% positive outcome discharges
Family Hope Services
95%
of discharges are positive outcome discharges.
Surpassing their target of 80% positive outcome discharges
Youth Forward Initiative
98%
of discharges are positive outcome discharges.
Surpassing their target of 80% positive outcome discharges
Demographics
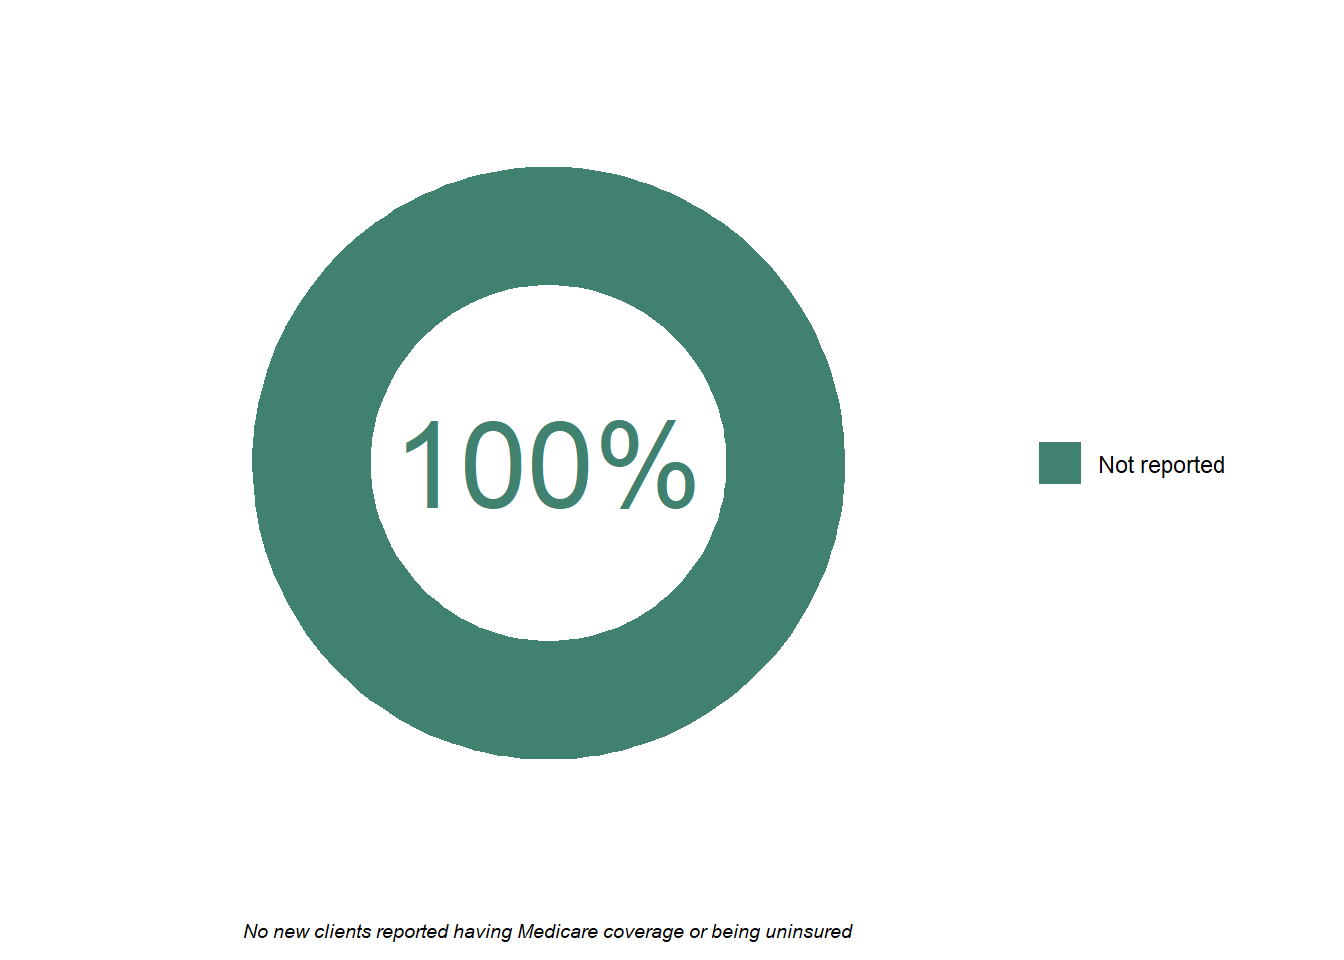
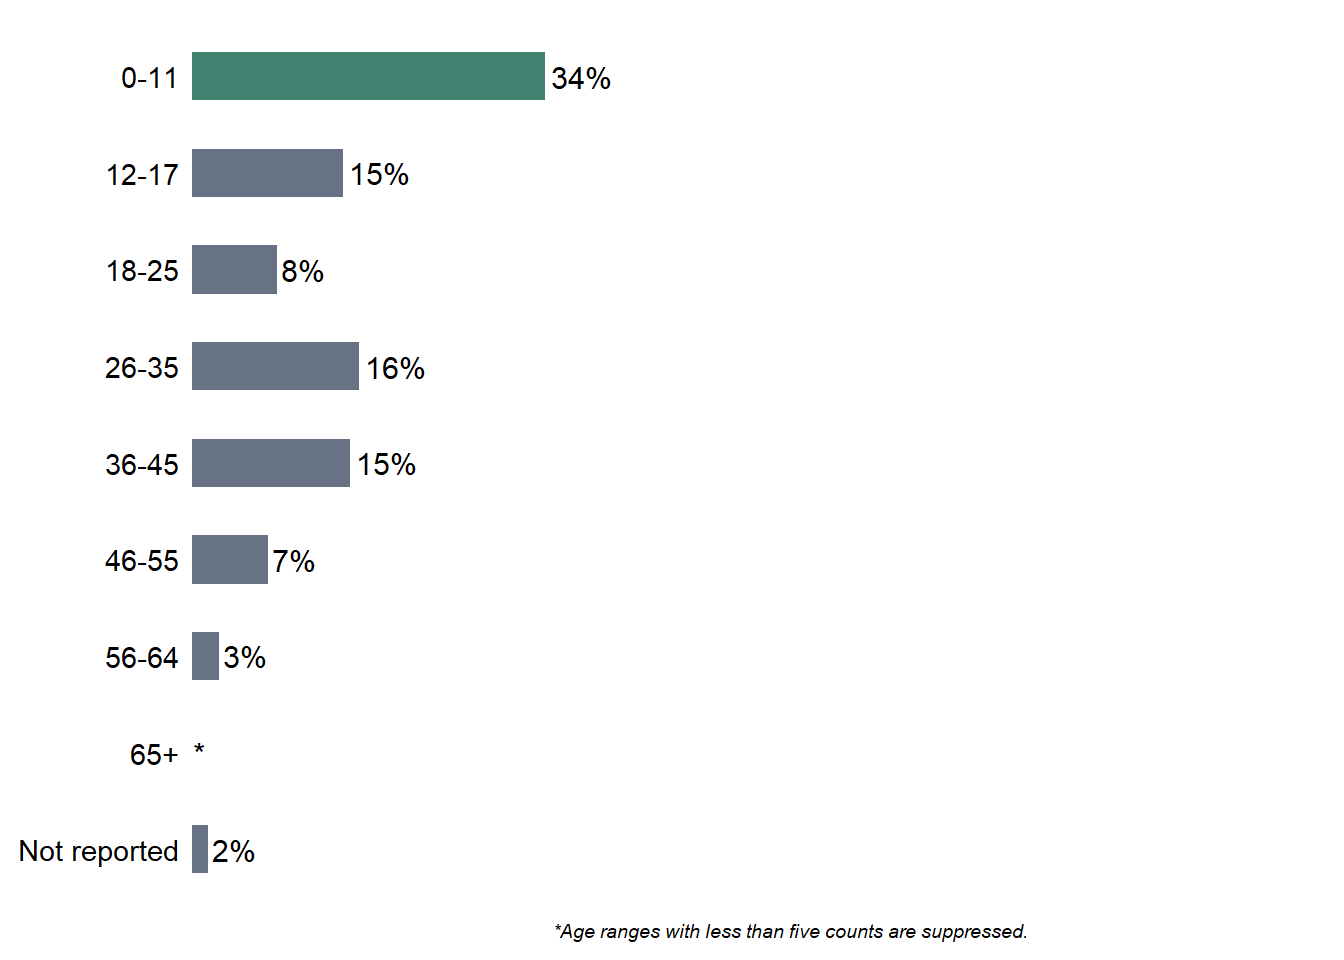
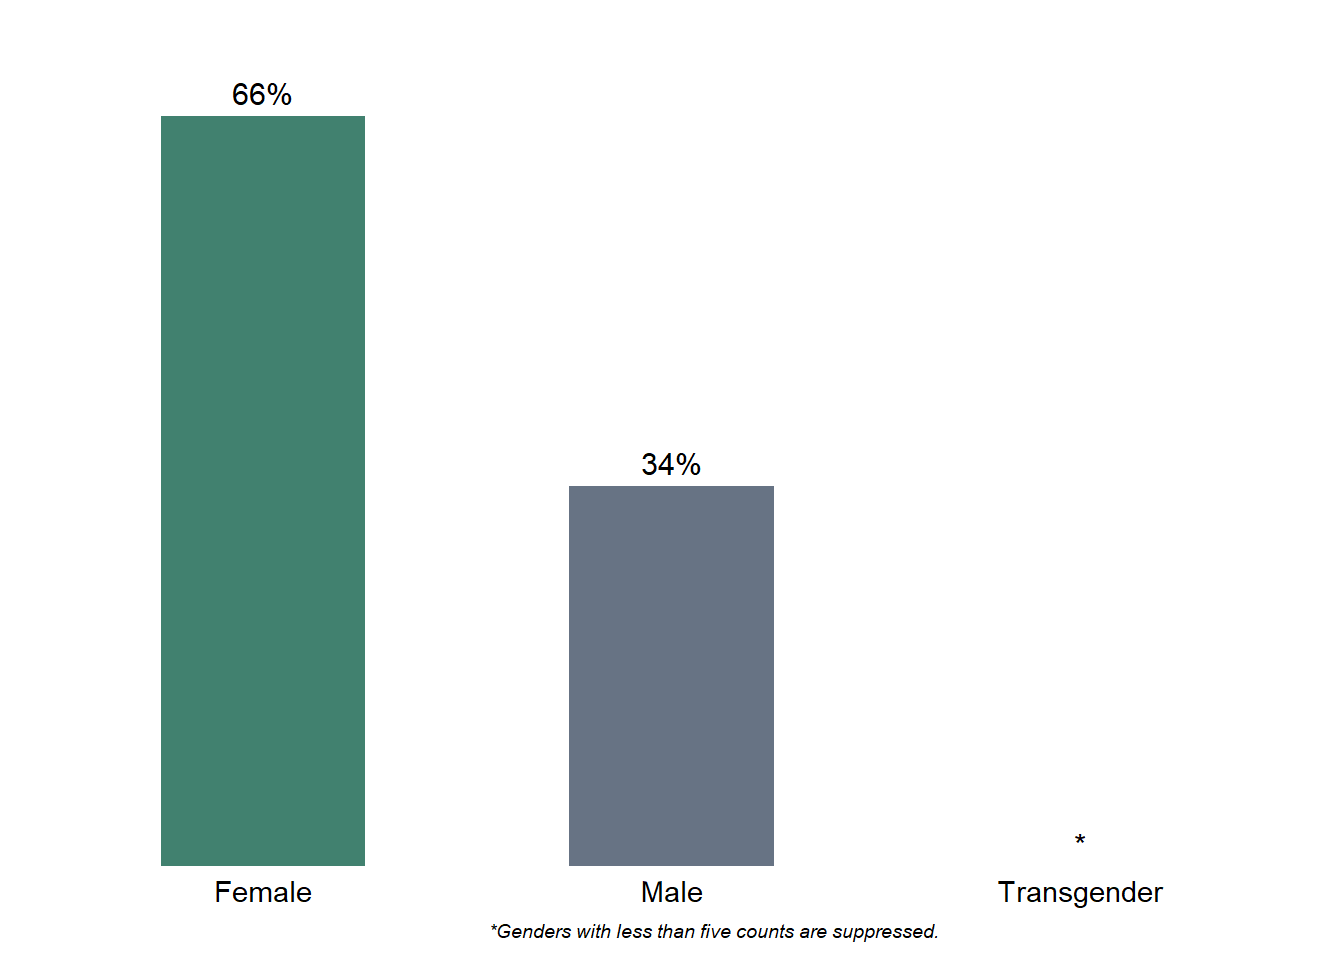
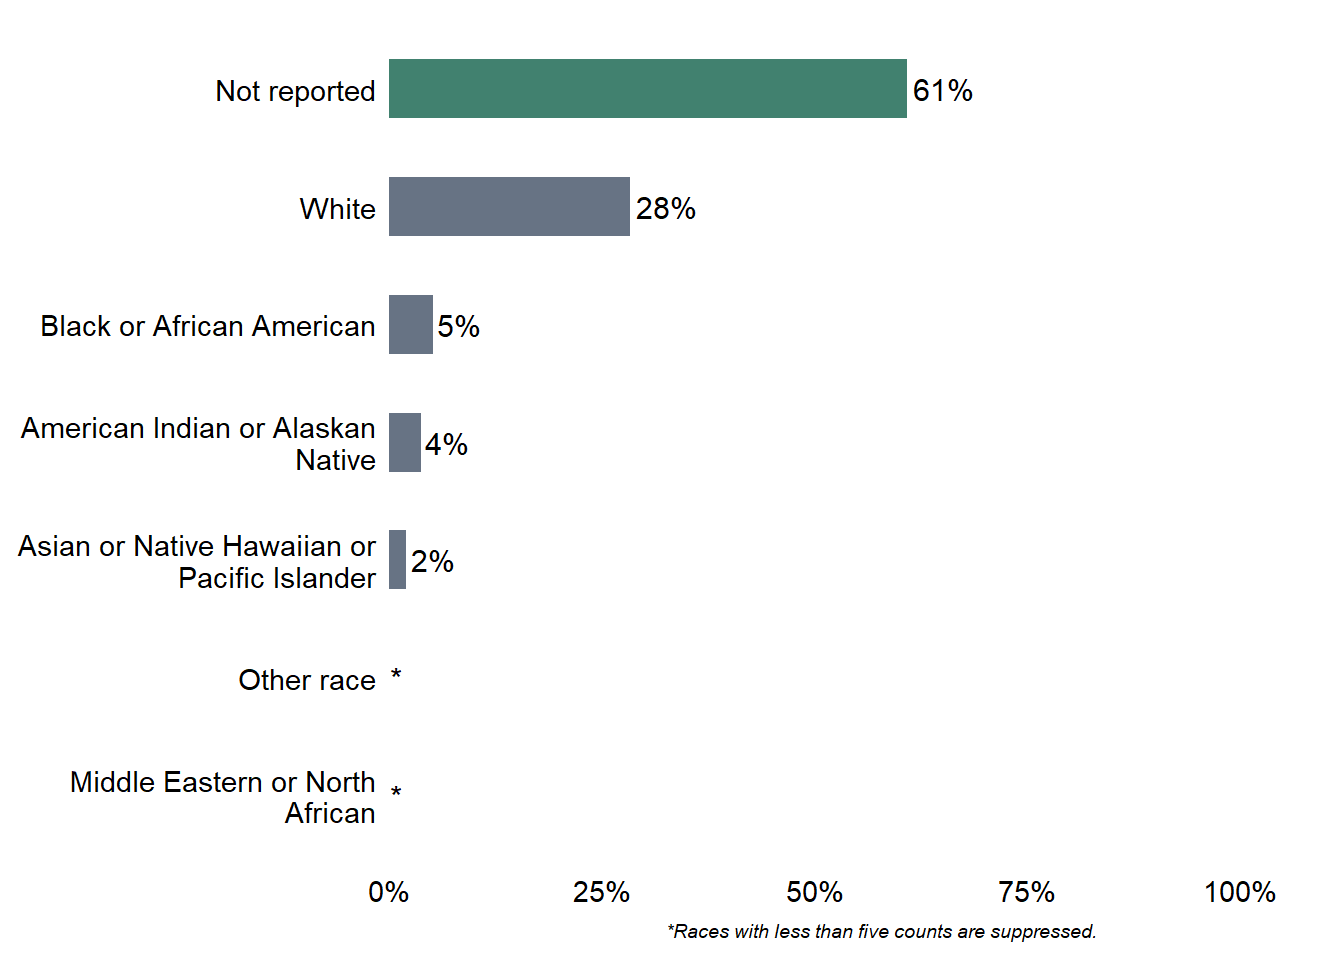
This section presents aggregate demographic information for new clients. Data includes age, gender, race, ethnicity, income, and insurance. Instances of data with a count less than five was suppressed.
TipAlignment with Evaluation Plan
Objective 1: Scope and Reach of Programs
- How many people does each provider serve? What are the target populations?
The majority (34%) of new ACEs clients are 0-11 years old
Female clients make up over half (66%) of total new ACEs clients
The majority (61%) of new ACEs clients did not report their race
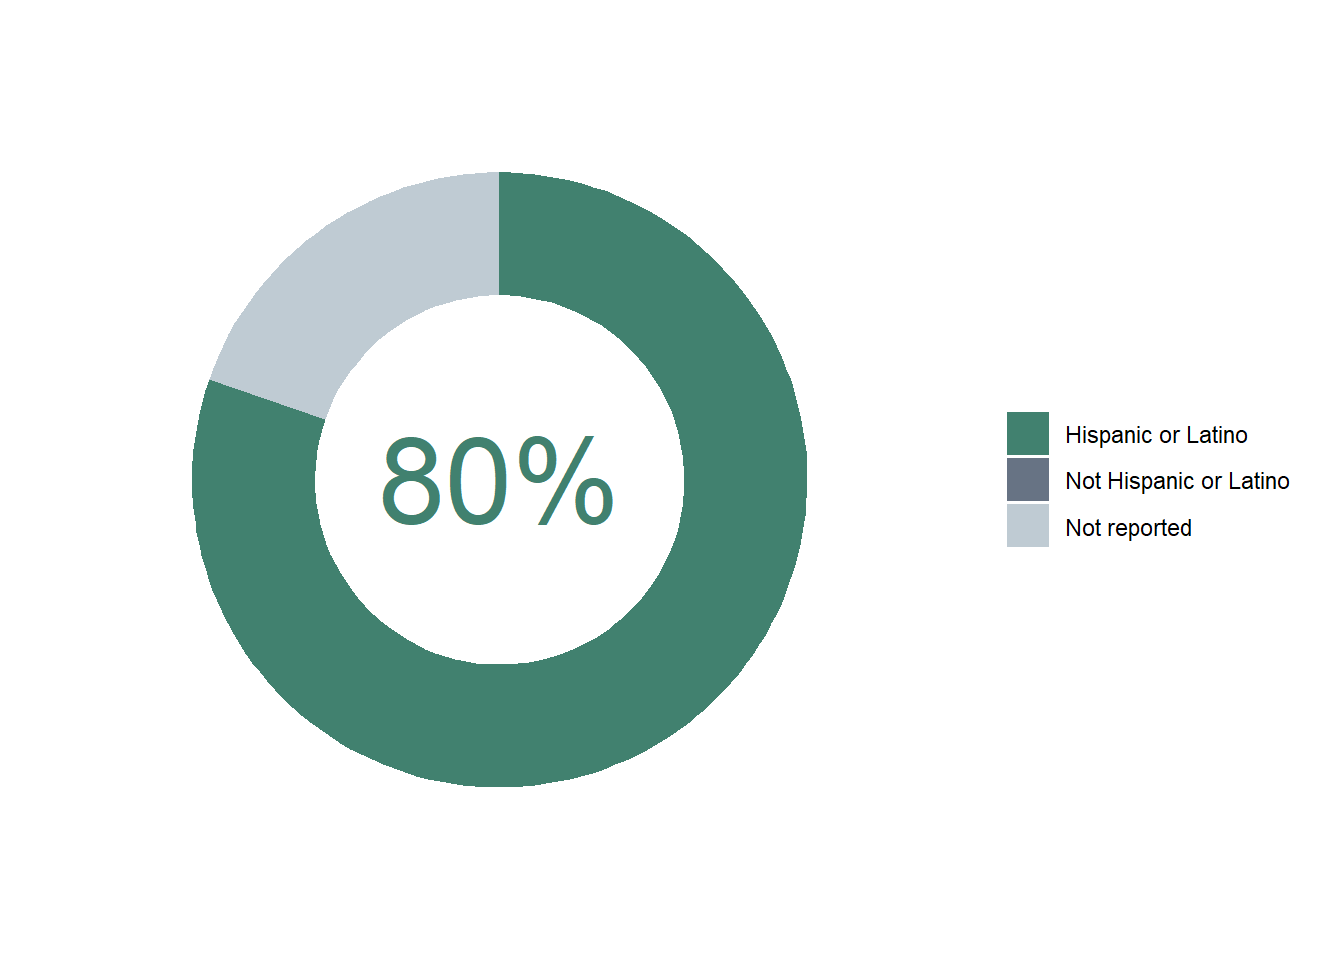
80% of new ACEs clients are Hispanic or Latino
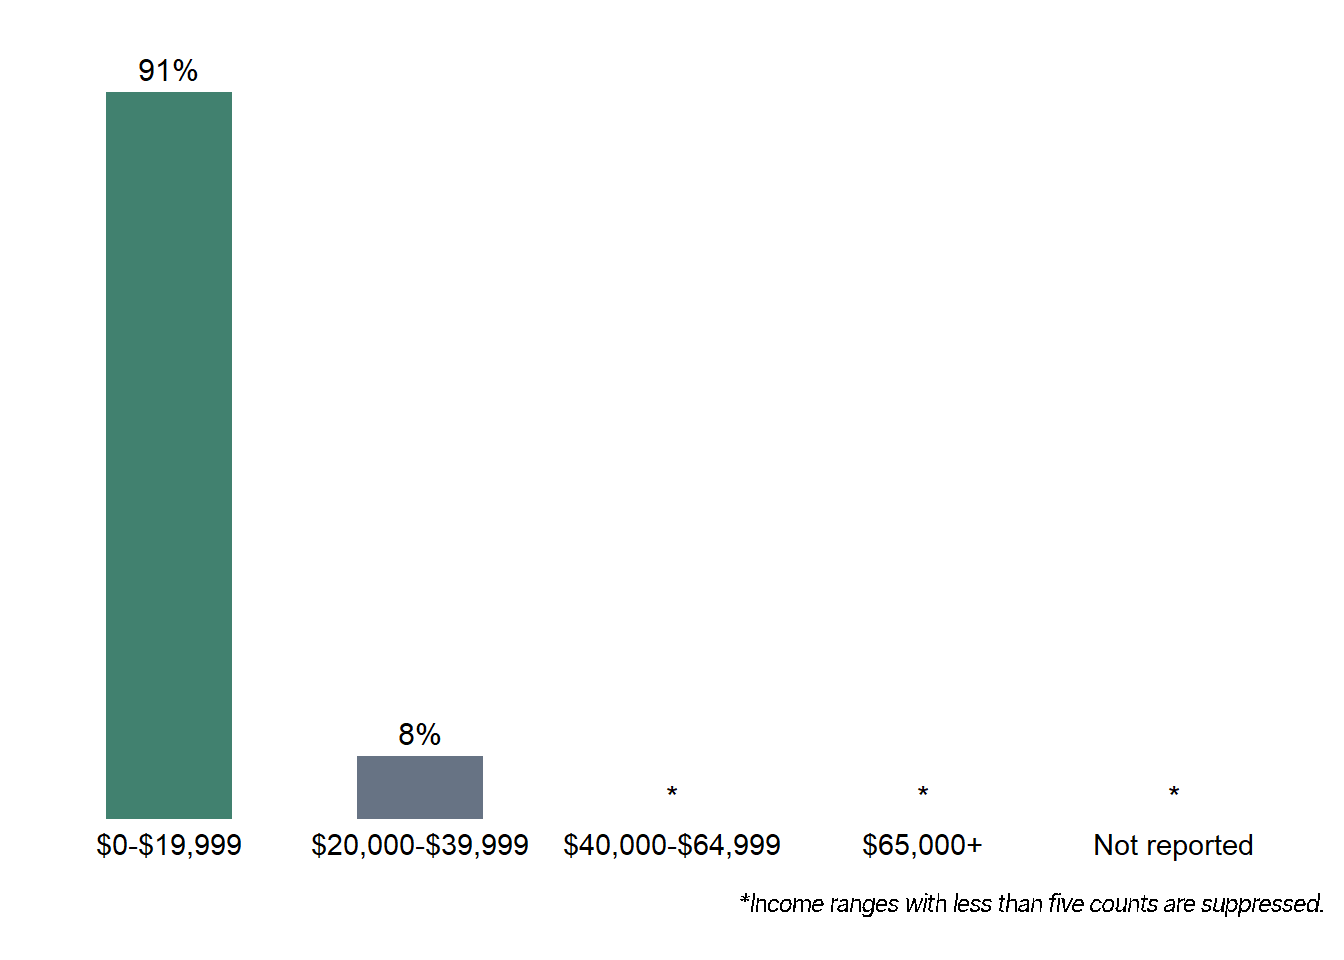
91% of new ACEs clients have an income of $0-$19,999
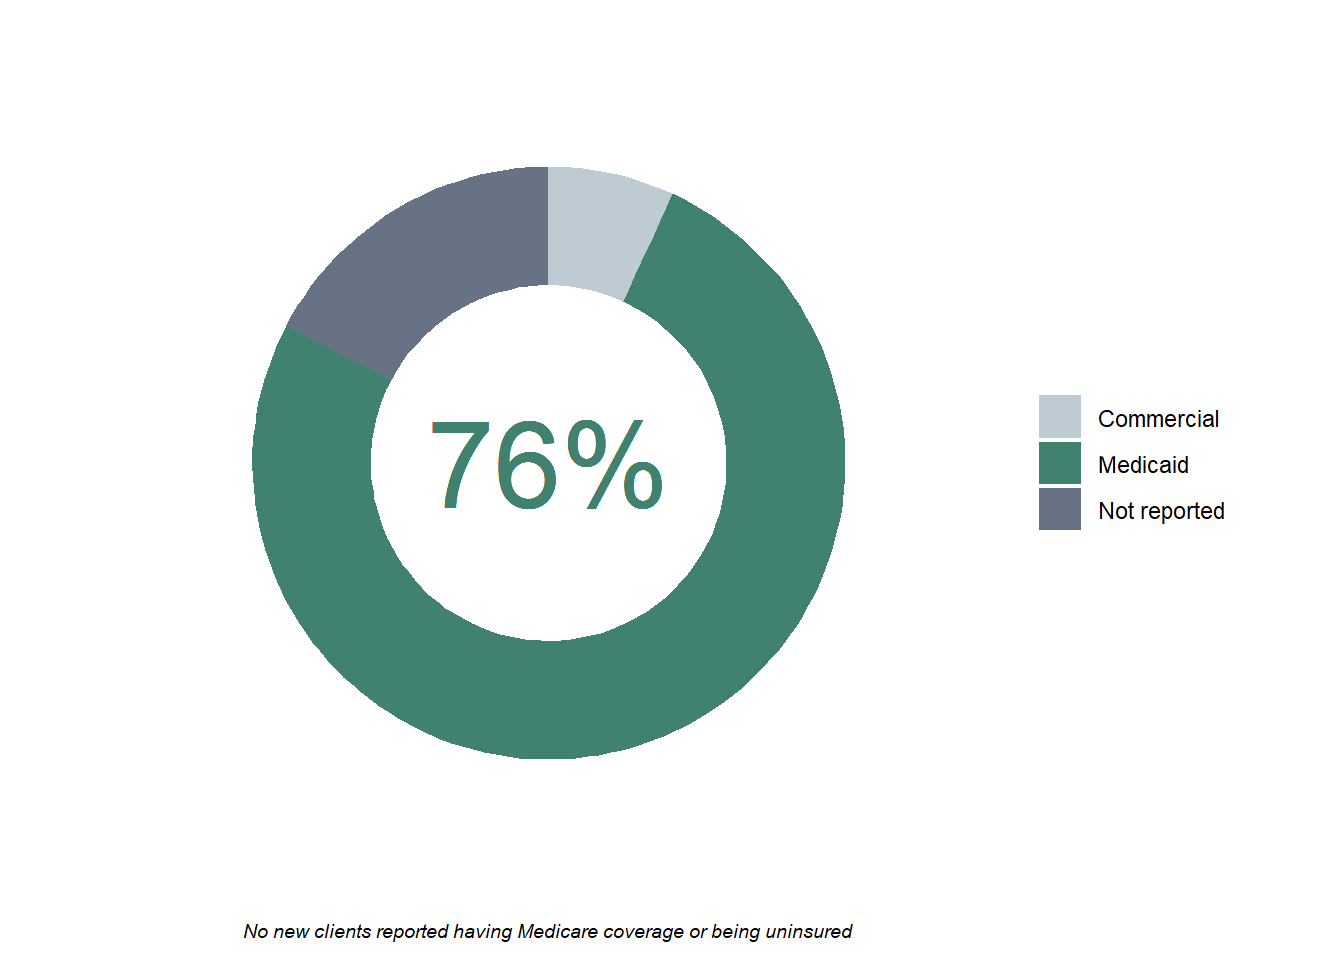
76% of new ACEs clients use Medicaid
Community Engagement & Staff Training
This section presents monthly data, by provider, on community events, street outreach events, and staff trained.
TipAlignment with Evaluation Plan
Objective 1: Scope and Reach of Programs
- What types of program activities are being implemented, and how often?
37
Total Community Events
across all SUP providers
July to December 2025
11
Total Street Events
across all SUP providers
July to December 2025
86
Total Staff Trained
across all SUP providers
July to December 2025
Community Events
Street Events
Client Services & Baseline Data
This section presents monthly data, by provider, on total new clients, average monthly clients, and the overall percentage of new clients with Baseline Data.
TipAlignment with Evaluation Plan
Objective 1: Scope and Reach of Programs
- How many people does each provider serve? What are the target populations?
746
Total New Clients
across all SUP providers
July to December 2025
760
Total New Primary Clients
across all SUP providers
July to December 2025
New Clients
This includes primary and secondary new clients, where applicable.
Average Monthly Clients
This includes all primary and secondary clients, both new and continuing.
Sunrise Youth Mentors
373
average monthly clients
Community Connections Club
310
average monthly clients
Overall Percentage of New Clients with Baseline Data
Please note, all providers have a target of 100% new clients with Baseline Data.
Sunrise Youth Mentors
67%
of new clients have Baseline Data.
Below target
Community Connections Club
98%
of new clients have Baseline Data.
Meeting target
Discharges
This section presents the overall percentage of positive outcome discharges, by provider.
TipAlignment with Evaluation Plan
Objective 2: Program Strengths and Challenges
- What are the barriers to program implementation and participant success, and how are these being addressed?
- How do participant behaviors and outcomes change over time?
12
Total Discharges
across all SUP providers
July to December 2025
Overall Percentage of Positive Outcome Discharges
Sunrise Youth Mentors and Community Connections Club do not collect data on positive outcome discharges because it is not a part of their program model.
Demographics
This section presents aggregate demographic information for new clients. Data includes age, gender, race, ethnicity, income, and insurance. Instances of data with a count less than five was suppressed.
TipAlignment with Evaluation Plan
Objective 1: Scope and Reach of Programs
- How many people does each provider serve? What are the target populations?
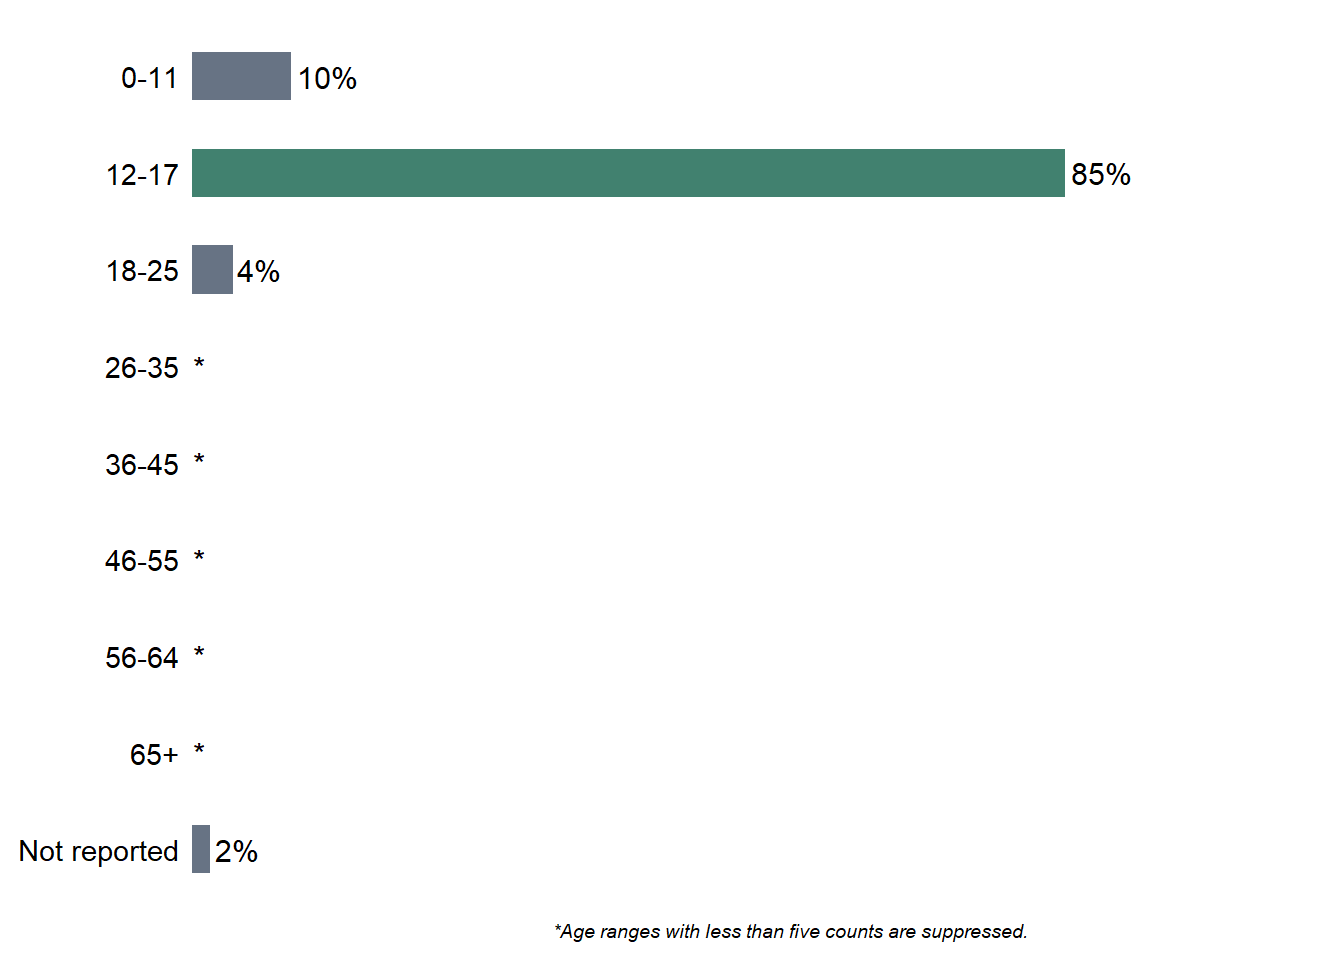
The majority (85%) of new Substance Use Prevention clients are 12-17 years old
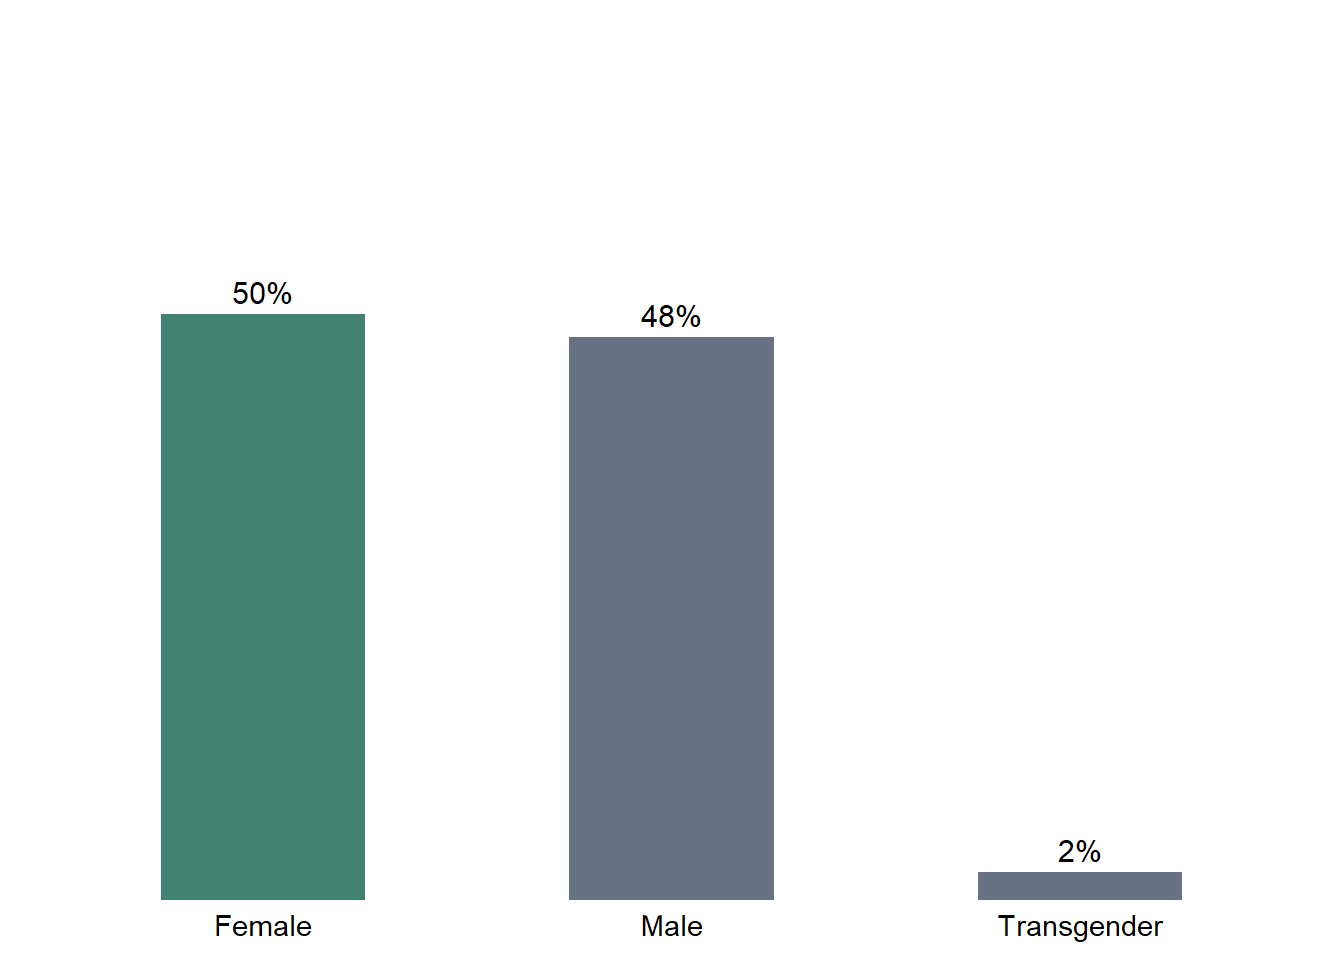
Female clients nearly half (50%) of total new Substance Use Prevention clients
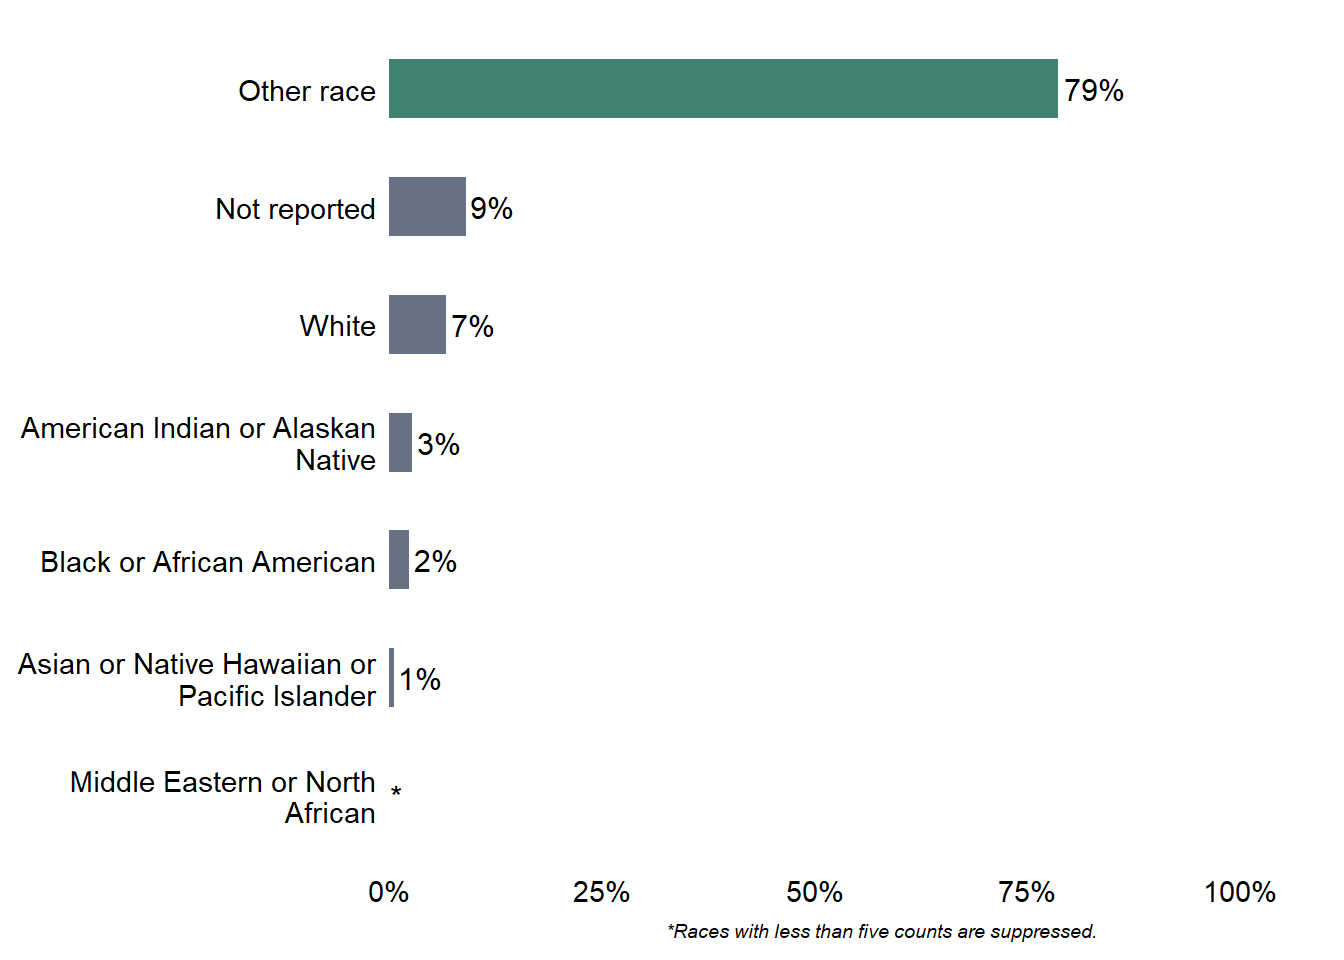
The majority (79%) of new Substance Use Prevention clients did not report their race
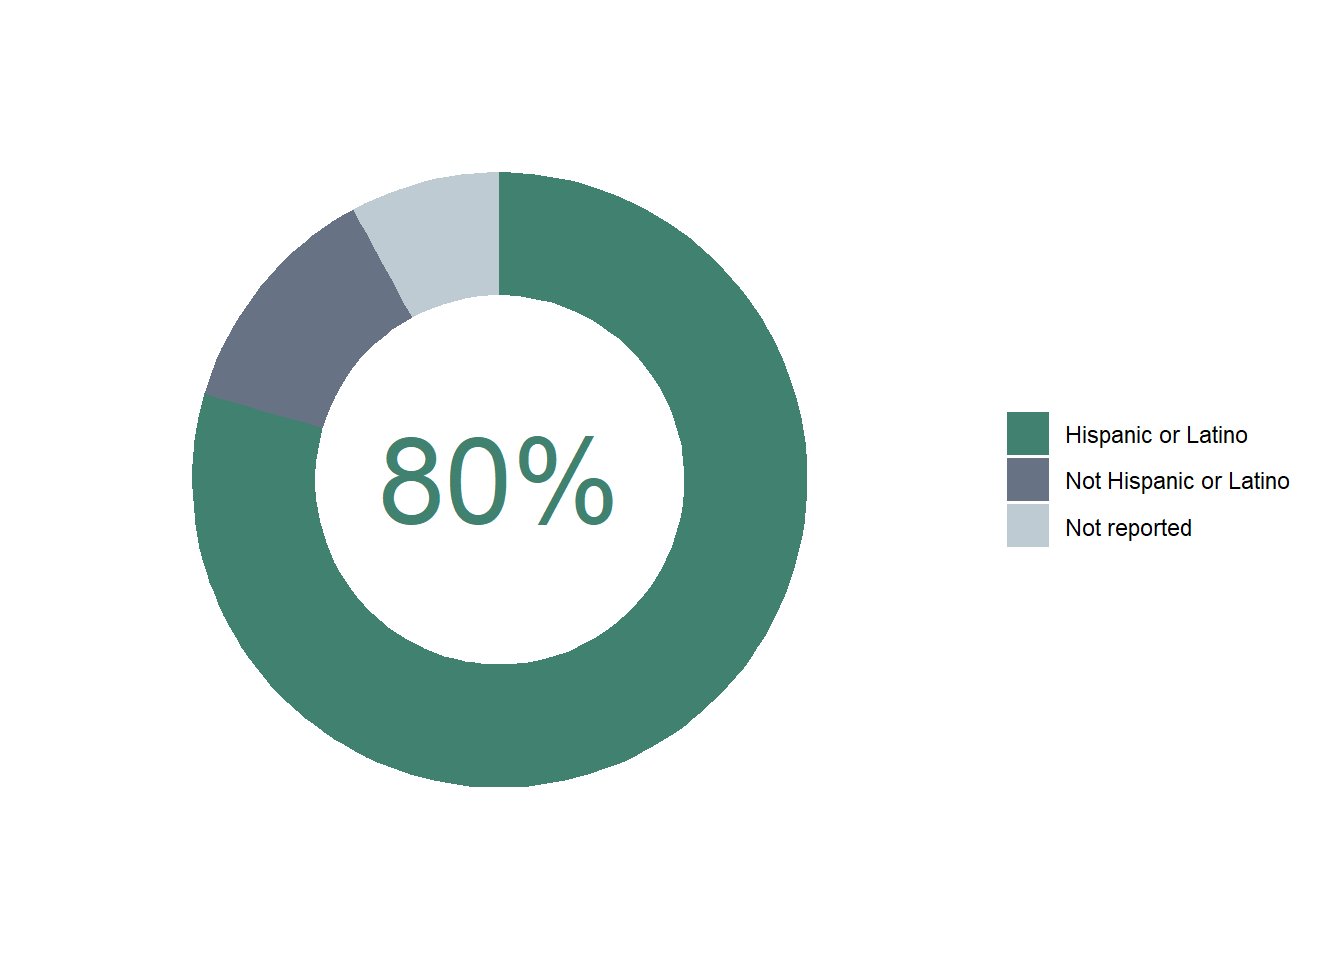
80% of new Substance Use Prevention clients are Hispanic or Latino
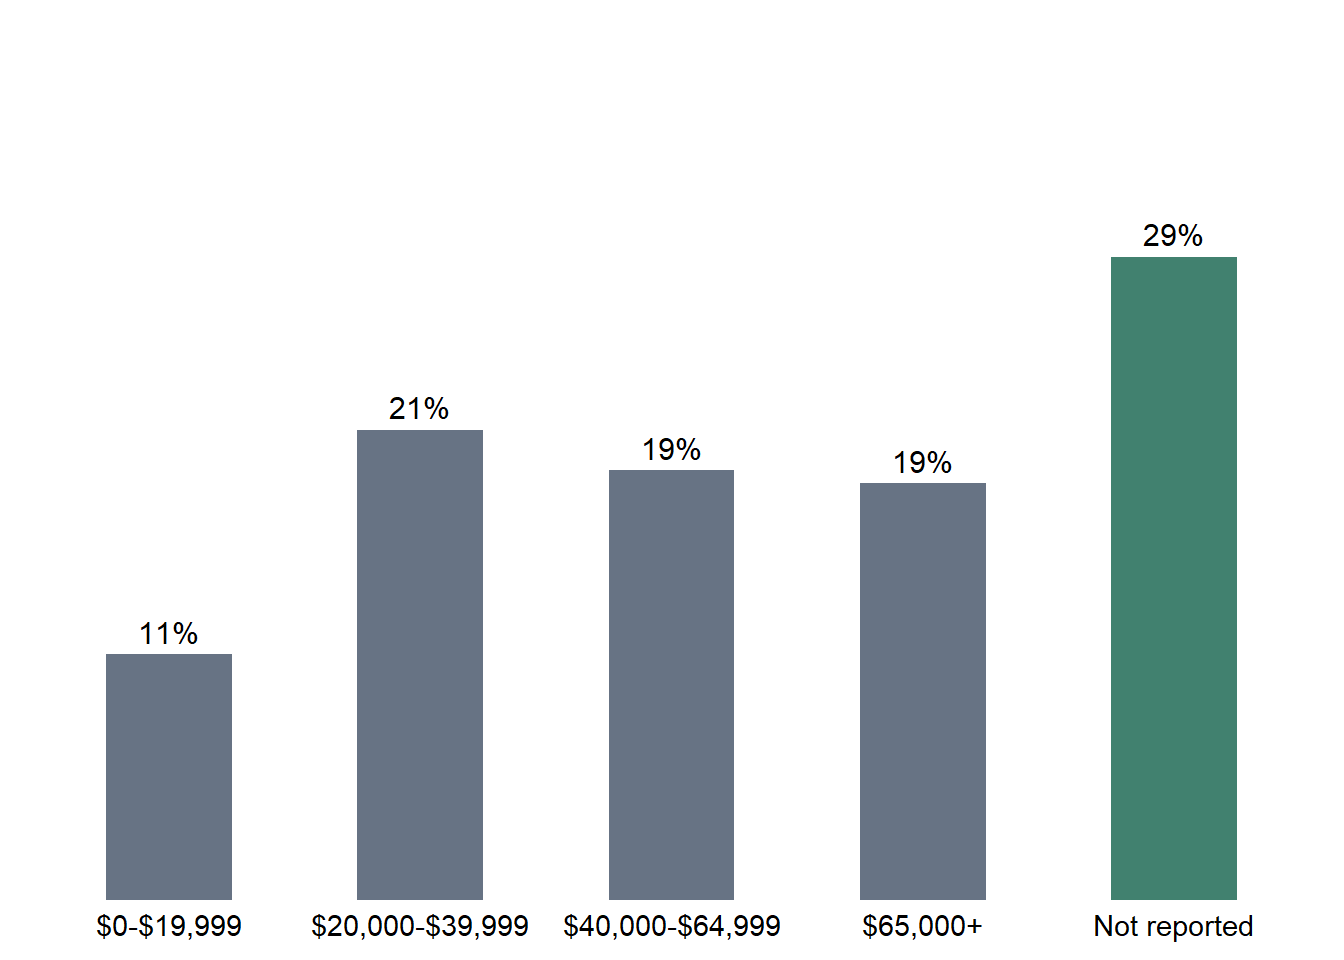
29% of new Substance Use Prevention clients did not report their income
100% of new Substance Use Prevention clients did not report their insurance